
Everyone Has an AGI Date. Here’s the Math Behind Each One.
S-Curves, Cat Brains, and the Uncomfortable Arithmetic That Separates 2028 Optimists from 2060 Skeptics


Elon Musk says AGI by 2026. Sam Altman says the end of the decade. Dario Amodei at Anthropic described systems “better than almost all humans at almost everything” by 2026 or 2027. Shane Legg of Google DeepMind gives roughly 50% odds for minimal AGI by 2028. Jensen Huang says 2029. Ray Kurzweil, who first published his prediction in 2005, holds firm at 2029 for AGI and has since moved his broader singularity timeline to around 2032. Yann LeCun thinks AGI is decades away, not years. Geoffrey Hinton says somewhere between 2028 and 2043.
These are not random guesses from random people. These are the individuals building, funding, and directing the most consequential AI systems on Earth. And their estimates span a range of nearly 40 years. So the question is not who is right, because nobody knows.
What reasoning produces each of these dates? Once you understand the math underneath the predictions, you understand what each person actually believes about the future, and what assumptions they are making that they rarely explain in public.
Step One: Quantify the Human Brain
The initial phase of modeling artificial general intelligence involves an inherently uncomfortable undertaking: developing a quantitative measure to compare biological intelligence with that of silicon. It is highly speculative. But it is where every timeline begins.
The human brain contains approximately 86 billion neurons interconnected by roughly 10¹⁴ synapses. Assuming an average firing frequency of 10 to 100 Hz per synapse, the brain’s raw computational capacity is estimated at around 10¹⁶ synaptic operations per second, or SOPS. That number sounds enormous, but it comes with an asterisk the size of a textbook, because neurons and transistors function in different ways.
Modern computers operate on the von Neumann architecture, which maintains a strict separation between processing and memory. Data has to travel between the two. The brain does not work this way. It combines processing and storage at the same location. This architectural difference alone imposes absolute thermodynamic limits on how efficiently silicon can approximate what a brain does.
A brain runs on roughly 20 watts. That is the power consumption of a small lightbulb. The supercomputers attempting to simulate even a fraction of brain-scale operations consume megawatts.
Google Warned Us, But This Japanese Lab Just Proved AI Doesn’t Need Our Data Anymore

On January 8th, a Japanese lab dropped a paper that honestly made me question everything I thought I knew about AI creativity. Sakana AI, working with MIC, just proved something wild: language models competing against each other in a game from the 1980s didn’t just match the best human players.
But the deeper problem is that counting neurons and synapses does not capture what a brain actually does. In 2009, Dharmendra Modha’s team at IBM attempted a cortical simulation at the scale of a cat’s cerebral cortex: approximately 1 billion neurons and 10 trillion synapses. They ran it on Dawn, a Blue Gene/P supercomputer at Lawrence Livermore National Laboratory, using 147,456 processors and approximately 0.5 petaflops of peak computing power. Despite that enormous infrastructure, the simulation ran 100 to 1,000 times slower than real time.
In 2009, simulating a cat-scale cortex in slow motion already required one of the most powerful machines on earth.
That publication drew a sharp response from Henry Markram, director of the Blue Brain Project at EPFL, who publicly argued that a brain is far more complex than a static map of neurons and synapses. The brain is a dynamic, plastic, biochemical system whose connections strengthen, weaken, appear, and disappear in response to activity and experience. Hormones like adrenaline add yet another layer of information processing. Counting the parts is not the same as understanding the machine.
He had a point. And yet, there is a useful observation buried inside the IBM experiment: the 0.5 petaflops that occupied an entire national laboratory in 2009 is now achievable with a single rack of modern GPUs. In fifteen years, what was required of a state-level institution has become a commodity.
The exponential growth curve is real, even if the target it is approaching is poorly defined.
The Conversion Problem
To compare brain capacity (measured in SOPS) with computer performance (measured in FLOPS), you need an equivalence unit. Researchers have studied this conversion using the Hodgkin-Huxley neuron model and Intel and IBM’s neuromorphic computing reports published in Science. The rough consensus, subject to enormous uncertainty: one synaptic operation requires approximately 10⁶ floating point operations to simulate faithfully. Which would put the brain’s equivalent compute at approximately 10²² FLOPS.
This number is almost certainly an underestimate for all the reasons Markram articulated. But it is the number that most AGI timeline projections use as their starting point, and it has one interesting property: it produces results that are not wildly out of line with independent expert surveys.
If you plot the average compute capacity of a typical data center from the invention of the first computers in 1941 through 2026, converting measured FLOPS to equivalent SOPS at each point, and then project the trend forward to 10²², you land at approximately 2056. That date is more robust than it appears. Before the LLM wave of 2023, survey-based estimates from AI researchers placed the median arrival of what we now call AGI at around 2060. Two entirely different methods, one computational and one sociological, converge within the same decade.
This is roughly where thinkers like Yann LeCun sit. And it is not far from Hinton’s outer bound of 2043.
The S-Curves Tell the Story
But the timeline projection above assumes that the current growth rate continues unchanged. And the history of computing suggests something more interesting is happening.
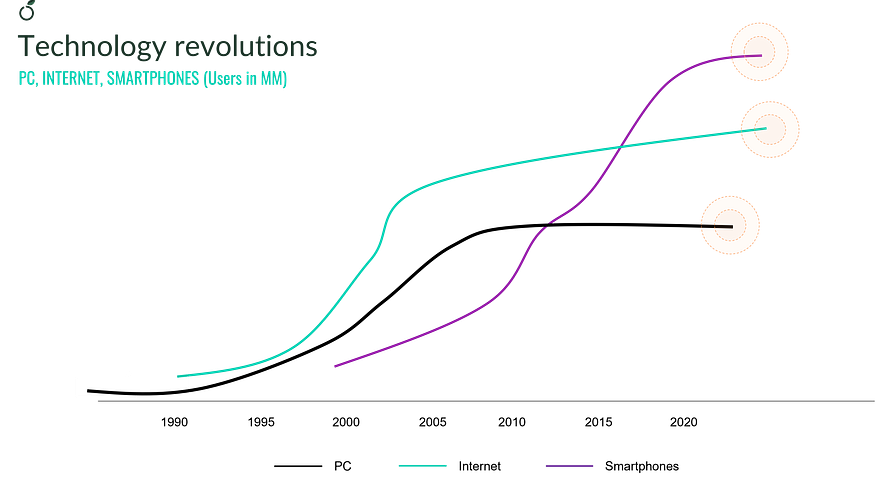
If you look at the compute capacity curve from 1941 to today, what you see is not a smooth exponential. It is a series of overlapping S-curves. Each S-curve represents a technology adoption cycle: slow early adoption by specialists, rapid acceleration as the technology goes mainstream, then a maturity phase where gains plateau and the next wave begins.
The mainframe era ran from the 1950s through the late 1970s. The microprocessor and personal computing era ran from the 1980s through the early 2000s. Cloud computing and modern data centers represent the current wave, which appears to be approaching its maturity plateau as it collides with the thermodynamic constraints of von Neumann architectures and the energy demands of AI training.
These S-curves have a fractal quality. Enormous waves decompose into smaller ones, and each successive wave is steeper than the last. Where electrification took 50 years to reach full adoption, the smartphone took fewer than ten. The compression of adoption cycles is itself accelerating.
From here, you face a binary choice. Either the current energy and architecture wall is impassable, meaning AGI will not arrive through simple scaling because we physically cannot move data between memory and compute fast enough without melting the hardware — a kind of Malthusian ceiling. Or a new technological wave is about to begin, and the compute growth curve will inflect upward again, as it always has. This is the Schumpeterian view:
Creative destruction will produce a next-generation S-curve, probably driven by some combination of neuromorphic processors, novel data center architectures, algorithmic breakthroughs like Yann LeCun’s world models, or fresh approaches to energy and compute distribution.
If you take the Malthusian view, AGI projections land around 2056 to 2060. If you take the Schumpeterian view and assume a new S-curve begins imminently, the projections pull forward to roughly 2035 to 2040.
Neither of these gets you to 2028. So how do Musk, Altman, and Amodei arrive at dates that are two to three years away?

The Acceleration Hypothesis
Everyone who tells you AGI arrives before 2030 is making one very large bet: that technology has already begun to self-accelerate in a way that is qualitatively different from anything the historical growth curves have measured.
Until now, the limiting factor for technological progress has been the rate at which information circulates through a network of human beings. The S-curves measured adoption by counting human users. But AI is not a technology that requires human adoption to scale. It can adapt itself, generate its own training data, write its own code, and optimize its own infrastructure. If AI reaches a threshold where its improvement loop no longer depends on human throughput, the S-curve stops being bound by human adoption dynamics and starts being bound only by compute availability and energy.
This is what the near-term optimists believe is already happening. Dario Amodei of Anthropic described systems better than almost all humans at almost everything, arriving by 2026 to 2027. Shane Legg gives 50% odds to minimal AGI by 2028. Jensen Huang targets 2029. Microsoft AI’s Mustafa Suleyman anticipates that by 2027, AI will be capable of performing most professional tasks at a human level. Demis Hassabis, speaking at the India AI Impact Summit in February 2026, described AGI as arriving within five years and compared its potential impact to “ten times the Industrial Revolution, happening at ten times the speed.”

It is important to note that someone has a vested financial interest in setting the date earlier. AGI timelines that are two to four years away drive investment, talent acquisition, and market positioning in the present. The marketing incentive is real and should be weighted accordingly.
But it is also worth noting how many of them converge on the same window, and how specific their reasoning is. They are not predicting a miracle. They state that self-reinforcing AI improvement, which we can already observe in harness optimization, code generation, and training pipeline acceleration, will compress the gap between what current architectures can do and what AGI requires.
What Each Timeline Actually Tells You
Once you understand the math, each prediction reveals its underlying assumptions.
If someone tells you AGI arrives in 2056 to 2060, they believe the current growth rate is fixed, and no paradigm-shifting technology will arrive. If they say 2035 to 2040, they expect a new S-curve but believe it will follow the historical pattern of prior technology waves. Also, if they say 2028 to 2030, they believe AI has already begun to self-accelerate and that the next S-curve will be steeper than any in history because the technology generating it does not depend on human adoption rates to scale.
And if someone tells you 2045, they are probably paying homage to Ray Kurzweil, who wrote in The Singularity Is Near in 2005 that AGI would arrive by 2029 and the technological singularity by 2045. Writing something in 2005 that does not make you look foolish in 2026 is an achievement that a lot of people in this industry would very much like to replicate.
The real takeaway is not which date is correct. Nobody knows. The takeaway is that the math behind each date reveals a worldview: about what limits progress, whether those limits are permanent, and whether AI is subject to the same adoption dynamics as every previous technology or whether it represents something categorically new.
The answer to that last question will determine whether superhuman intelligence is measured in decades or in years.
Thanks for reading. Comment your thoughts. And we will find out which camp was right within our lifetimes.
What I want to know is when we reach AGI, will AI hallucinate less or more. Today, hallucinations are fairly common with no remorse. How will the trainers correct this issue.